[Research] Quadratic Voting in HCI

Table of Contents
Presentation Video #
Considering Quadratic Voting as an alternative #
Researchers often use surveys to elicit stakeholders’ preferences to inform decisions about allocating limited resources. With accurate responses from the stakeholders, decision-makers can better allocate resources and improve stakeholder welfare. However, much research, up until today, shows how difficult it is to elicit accurate and rich self-reported preferences. This is why we conducted two experiments that tested an alternative method – Quadratic Voting – with how it compared to one of the most widely used methods – Likert-scaled Surveys – with an individual’s true preference.
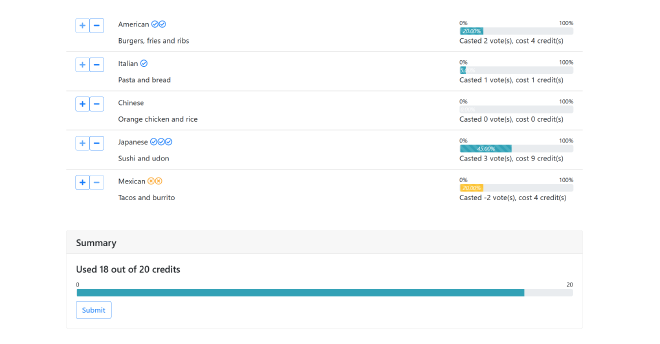
Quadratic Voting (QV), an idea made popular by Lalley and Weyl, is a computational voting tool where voters have to pay quadratically to cast any number of votes across options within a given budget. We think this method is a promising alternative that appears to balance the rating and ranking-based survey instruments. You can play with our demo QV questionnaire.
One of the reason why we think QV could work lies behind the idea that individuals make more rational decisions under scarcity constraints because it forces individuals to ignore contextual cues, thus becoming more reasonable.
“When scarcity captures the mind, we become more attentive and efficient.” ― Sendhil Mullainathan and Eldar Shafir, Scarcity: Why Having Too Little Means So Much
Comparing survey results with participant behaviors #
We conducted two experiments both trying to compare how different were each survey techniques compared with participants’ behaviors?
Our first experiment considers societal causes. We divided participants into QV Group and Likert Groups. We ask participants: What do citizens prioritize different societal causes in the US? The Likert group will express their opinions on nine different societal issues using a Likert scale survey. The QV Group would complete two of the three QV surveys with either a small, medium, or large budget of credits.
We ask participants, consider winning a bonus of the experiment, to do a voluntary donation task on charities of the nine causes to model an their true preferences. Participants should only donate more to one organization if they care more about its cause. We calculate the cosine similarity angle between the donation amount and the votes and ratings in surveys to capture the degree of alignment between voters’ preferences and their voting and surveying results. Our Bayesian modeling result shows the mean angle of each of the four groups.
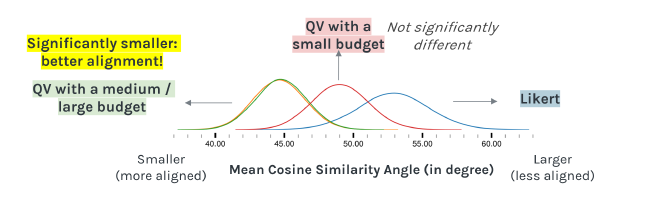
We see that QV with medium and large budgets have a smaller mean difference between the survey method and the donation amont, suggesting a better alignment.
In our second experiment, we asked participants to express their preferences on how they value different aspects of a video-watching experience. This time, all participants completed both QV and Likert before a pricing task. Participants expressed their values using the survey and voting tool. mimicking how the UX research community often utilizes surveys to understand users to allocate development resources.
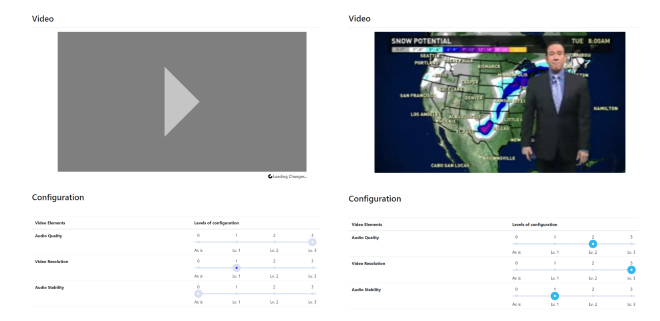
With this scenario, we designed another incentive-compatible task where participants would design a video product and price their design. We view this price as one’s willingness-to-pay. The participant’s best strategy is to estimate how they value the different video components truthfully. Using the same analysis method, We arrive at the same conclusion that QV’s responses align significantly closer to the true preferences than those from Likert.
Beyond Two QV experiments #
This experiment shows that a change in mechanism design by imposing a constraint and calculating costs will nudge participants to a trade-off thinking mindset. The results are surprising how sensitive and powerful mechanisms can support people in expressing more “truthful” attitudes.
We believe that our study is just a starting point for understanding and deploying this instrument and has opened the door to many interesting questions. For example, we have yet to uncover respondents’ mental models of how they respond to QV surveys. And it is important to investigate how QV compares to other surveying methods and how well it works for other scenarios. Last but not least, what would a well-designed QV interface look like?
For many decision-makers, stakeholder surveys are critical to better understanding their preferences. A survey tool that could elicit accurate responses from the stakeholders could yield better resource allocations from the decision-makers, improving stakeholder welfare. Through careful experiments, we have shown that Quadratically constrained surveys better elicit an individual’s true preferences. QV accomplishes this by encouraging respondents to deliberate amongst preferences via accessible trade-offs amongst the choices.
If you are interested in more details of this work, please refer to our research paper. We are working on a QV platform to make QV-based surveys widely accessible so that non-computer scientists can easily use this survey instrument, and you can sign-up at surveyish.org. And of course, please do reach out if you are still hesitant about incorporating QV in your next decision-making process or research study. We hope you are excited as we (or the cat) are!

Resources #
@article{10.1145/3449281,
author: {Cheng, Ti-Chung and Li, Tiffany Wenting and Chou, Yi-Hung and Karahalios, Karrie and Sundaram, Hari},
title: {"I Can Show What I Really like.": Eliciting Preferences via Quadratic Voting},
year: {2021},
issue_date: {April 2021},
publisher: {Association for Computing Machinery},
address: {New York, NY, USA},
volume: {5},
number: {CSCW1},
url: {https://doi.org/10.1145/3449281},
doi: {10.1145/3449281},
journal: {Proc. ACM Hum.-Comput. Interact.},
month: {apr},
articleno: {182},
numpages: {43},
keywords: {likert scale, quadratic voting, collective decision-making, empirical studies}
}

@data{illinoisdatabankIDB-1928463,
  doi: {10.13012/B2IDB-1928463_V1},
  url: {https://doi.org/10.13012/B2IDB-1928463_V1},
  author: {Cheng, Ti-Chung and Li, Tiffany Wenting and Karahalios, Karrie and Sundaram, Hari},
  publisher: {University of Illinois at Urbana-Champaign},
  title: {Dataset for '"I can show what I really like.": Eliciting Preferences via Quadratic Voting'},
  year: {2021}
}